Use orbit, timebase, and shaft centerline plots to display shaft motion. The most common use for the orbit, timebase, and shaft centerline plots is to monitor turbomachinery with fluid film bearings. Some turbomachinery mechanical faults have characteristic plot shapes. You can compare the acquired plots with any known characteristics to detect faults and diagnose machine problems.
You mount two proximity probes orthogonally on a fluid film bearing to acquire the signals for the orbit, timebase, and shaft centerline plots. An orbit plot shows the dynamic motion of the center of a rotating shaft with signals from two proximity probes. A timebase plot displays dynamic vibration amplitude information with the same proximity probe signals as the orbit plot. The timebase plot displays the signals as a function of time in one or more revolutions with two separate plots. A shaft centerline plot displays the shaft center DC position changes within a bearing clearance range. An orbit plot represents the shaft center AC dynamic motion. Use a shaft centerline plot with an orbit plot to track both aspects of shaft motion.
The following illustration shows how you might configure a system to display an orbit plot and a shaft centerline plot.
In the previous illustration, two orthogonally-mounted proximity probes measure the shaft motion. The outer circle depicts the bearing clearance. As the shaft speeds up in the counterclockwise (CCW) rotation direction, the shaft center moves from the bottom of the bearing clearance to the normal operational center, as the Shaft Centerline shows. As the shaft continues in normal operation, the shaft center moves around the normal operating center, as the Shaft Orbit shows.
Orbit Plot
An orbit plot generates a two-dimensional image of the shaft center motion. Use the OA Orbit Plot VI to display both filtered and unfiltered orbit plots. An unfiltered orbit plot displays the shaft motion based on even-angle signal data. The unfiltered plot shows the direct motion of the shaft center and displays all orders. A filtered orbit plot displays the shaft motion based on vector signal data. The filtered plot shows the synchronous motion of a particular order.
The following illustration shows a filtered orbit plot and the typical setup for monitoring a rotating shaft with an orbit plot.
The X and Y proximity probes, which are two probes of the same type mounted 90 degrees apart, monitor the shaft. If you do not use two orthogonally-mounted probes, the orbit plot might appear skewed.
Probe Angle Correction
In many cases, you cannot mount probes easily in the desired 90 degrees out of phase horizontal and vertical orientation. Probes often have a 45-degree deviation instead. The following illustration shows the common mounting positions for X and Y probes.
An orbit plot assumes that the signals are from probes in true horizontal and vertical positions. To display data with respect to a true vertical and horizontal coordinate system, you must rotate the data by the probe angular offset from the desired coordinates. The following illustration shows the effect of compensating for a 45-degree mounting position.
You can use the OAT Orbit Plot VI to rotate an orbit plot to the true horizontal and vertical probe orientations.
Timebase Plot
A timebase plot displays the vibration amplitude of one or more revolutions of a shaft as a function of time. Whereas an orbit plot shows the whole picture of the rotating shaft, a timebase plot enables you to get a clearer picture of what an individual transducer acquires in terms of vibration amplitude. The timebase plot follows the same convention as the orbit plot. The following front panel shows a typical unfiltered timebase plot for the x-axis and y-axis.
In the previous plot, each dot represents the trigger pulse position.
Use the OA Timebase Plot VI to display both unfiltered and filtered timebase plots. An unfiltered timebase plot displays the shaft vibration with an even-angle signal. A filtered timebase plot displays the shaft vibration with a vector signal. The filtered timebase plot shows only the synchronous motion of a certain order.
Shaft Centerline Plot
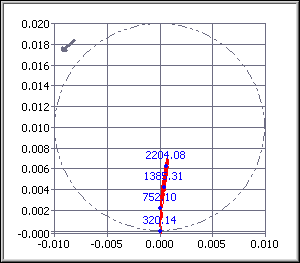
Use a shaft centerline plot to display changes in radial rotor position with respect to a stationary bearing over a range of time or speed. The DC gap voltage from two orthogonally-mounted proximity probes determines the averaged position change. The following illustration shows a typical shaft centerline plot of a machine startup.

The numeric values on the above plot correspond to the rotational speed.
Displaying a Shaft Centerline Plot
You can use the OAT DC Gap Estimator VI to compute the DC gap values from the X and Y proximity probes. You then can use the OAT Shaft Centerline Plot VI to display the shaft centerline plot with DC gaps.
The shaft centerline plot follows the same true vertical and true horizontal convention as the orbit plot. You can use the OAT Shaft Centerline Plot VI to rotate the plot to true vertical and true horizontal positions.
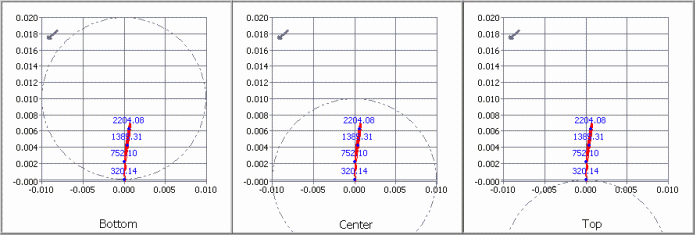
When displaying a shaft centerline plot, you must specify the bearing clearance and shaft centerline starting point reference. Three types of starting point references are as follows:
- Bottom—Use the bottom starting point reference for a horizontal machine train.
- Center—Use the center starting point reference for a vertical machine train.
- Top—Use the top starting point reference for overhung rotors, such as fans and compressors.
The following illustration shows three shaft centerline plots with different start point references.

You can see that the starting point reference you choose affects the boundary position of the bearing clearance in a shaft centerline plot.


I would like to know what determines the orientation of the X and Y probe. Is it based on rotation of the shaft, driver, designer or end user?
ReplyDelete